Wednesday, July 21, 2010

Z Swipe Tool for ArcGIS Desktop 10

Z Swipe Tool for ArcGIS Desktop 10

Z Swipe Tool for ArcGIS Desktop 10

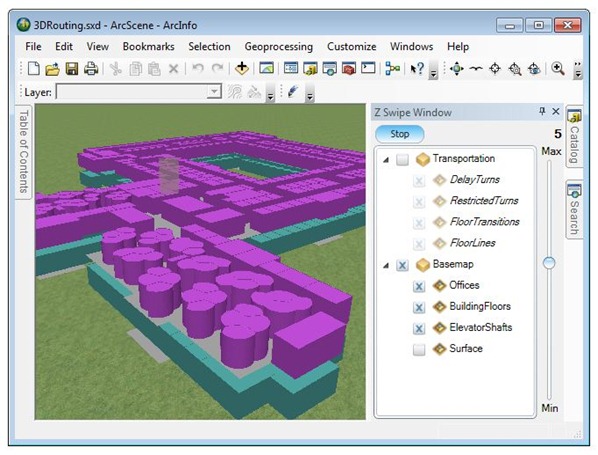
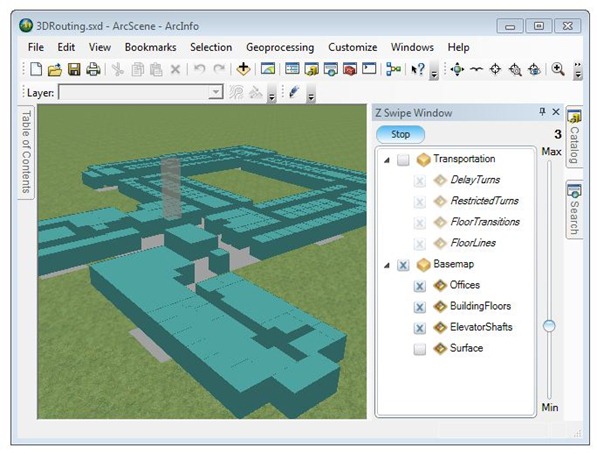
ESRI’s Applications Prototype Lab has just published a new addin to the code gallery called the Z Swipe Tool.  The addin allows users to filter features in ArcScene based on vertical position using a slider.  Under-the-hood, the addin works by dynamically amending the definition queries of participating layers.  The Z Swipe Window (pictured above) contains a tree view for users to select (or de-select) participating layers.

The addin is ideal for working with documents with vertically concurrent features such as floors and services of a high-rise building.

The addin is available here and includes full source code.
Tuesday, July 20, 2010

ArcGIS Diagrammer for ArcGIS 10 Released

ArcGIS Diagrammer

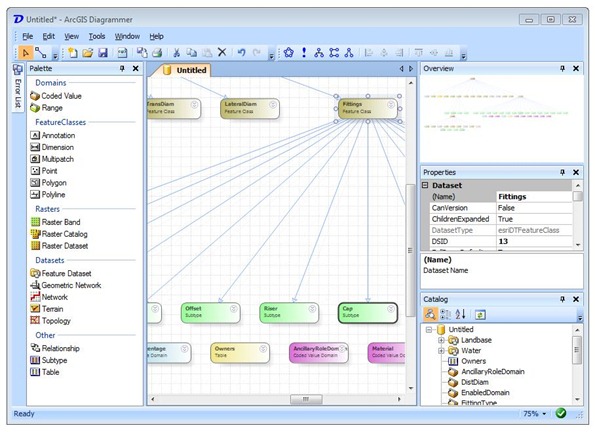
ArcGIS Diagrammer is now available for the newly released ArcGIS 10.  The application can be downloaded here from the new code gallery on the ArcGIS resource center.

If you still have ArcGIS Desktop 9.2 or 9.3 then you can still use the previous version available here on ArcScripts.

The most significant change or addition to Diagrammer in the 10 release is the addition of Terrain dataset support.  Unfortunately we could not add support for mosaic datasets because they currently do not support xml serialization, that is, terrains are currently omitted from xml workspace documents exported from geodatabases.  Diagrammer also needed to be updated to reflect changes to how ArcGIS 10 manages metadata.  Overall it is basically the same Diagrammer you love or hate.  :-)

If you think that concepts presented in ArcGIS Diagrammer (and other samples like XRay) should be formally ported into the core ArcGIS product then please voice your opinion on ESRI’s ideas forum.

Friday, July 16, 2010

Presentation AddIn for ArcGIS Desktop 10

Presentation AddIn for ArcGIS Desktop 10

About this time last year, the Applications Prototype Lab at ESRI published a presentation tool for ArcGIS 9.2/9.3.  That release is discussed here and can be downloaded from the old code gallery here.

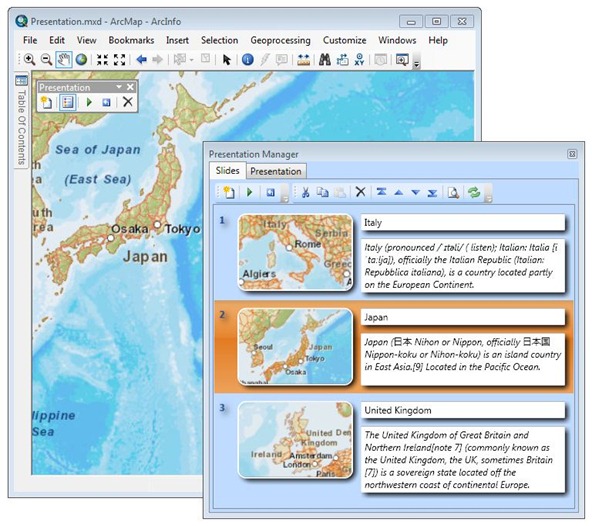
Today, the lab released a new version of the presentation tool as an AddIn for ArcGIS 10.  This AddIn is similar to the presentation capability recently added to ArcGIS Explorer.  The AddIn can be downloaded here from the new code gallery.

The AddIn was developed in C# for .NET 3.5 and utilizes the graphics capabilities of WPF.  Full source code is provided with the code gallery download.

Thursday, July 15, 2010

Touch for ArcGIS Desktop 10

Touch for ArcGIS Desktop

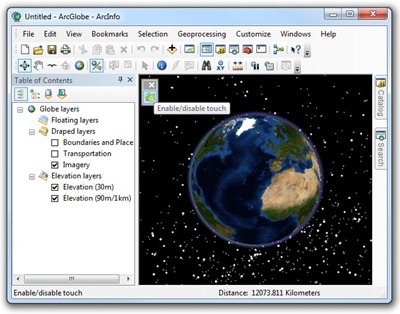
Just published on the ArcGIS Resource Center is a proof-of-concept developed by the ESRI’s Applications Prototype Lab called Touch for ArcGIS Desktop. This contribution is an AddIn that adds touch navigation to ArcGlobe.  The contribution can be downloaded from here and includes the AddIn itself and full source code.  The download page includes instructions how to install and use the AddIn.

The AddIn will install on any computer running ArcGIS 10 but a warning message will appear if you do not have a Windows 7 Touch-enabled device connected.

This AddIn is based on code from the Windows 7 Multitouch .NET Interop Sample Library.

GeoTagger for ArcGIS Desktop 10

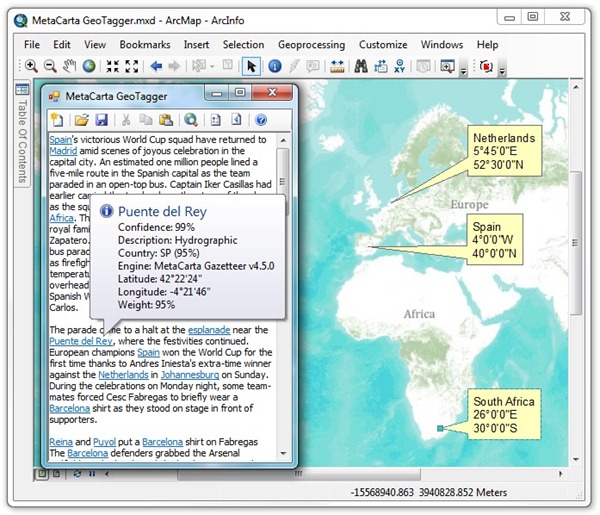
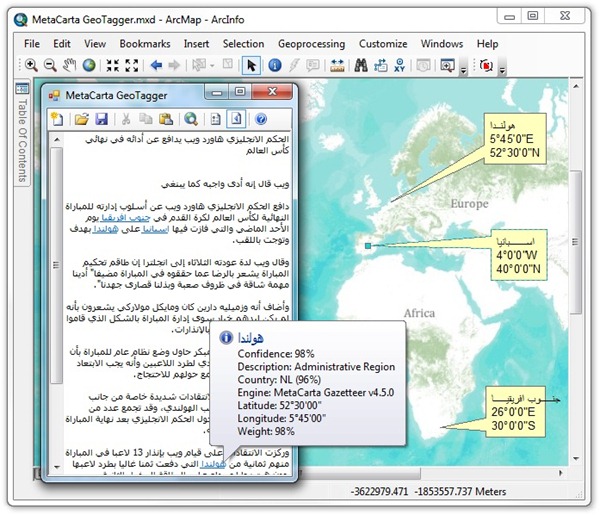
Geotagging text from an English web page  Geotagging text from an Arabic web page

Have you ever wanted to extract geographic locations from an email or web page? This is now possible with the free GeoTagger AddIn for ArcGIS Desktop 10 published by the Applications Prototype Lab. The AddIn uses MetaCarta’s public geotagging web service to extract geographic references from text. The service supports English, Russian, Spanish and Arabic.

The AddIn is available here from ESRI’s ArcGIS Resource Center.  The download page includes usage and installation instructions.  Source code is bundled with the download.

Wednesday, July 14, 2010

Dynamic Charting for ArcGIS Desktop 10

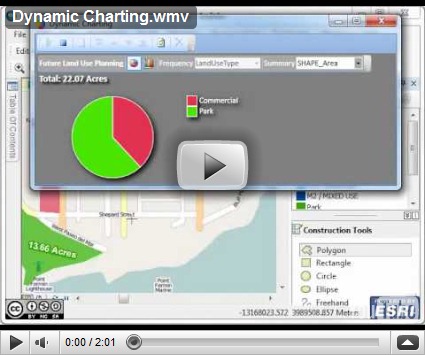
Late last year ESRI’s Applications Prototype Lab released the dynamic charting tool for ArcGIS Desktop 9.2/9.3.  This tool provided the unique ability to display dynamic pie charts during editing operations.

Today, the lab released a new version of the tool for the newly launched ArcGIS Desktop 10.  The tool features a number of improvements:

  • Ability to switch between a pie chart and a column chart,
  • Ability to pick any summary field other than area, for example, cost or mineral volume,
  • Improved performance, the charts are only updated following an editing operation such as an add or delete.  Previously updates occurred at regular time intervals.
  • The legend is now sorted alphabetically,
  • And mostly importantly, the user interface colors have been toned down.  :-)

The new tool can be downloaded from the ArcGIS Resource Center from this link.  The download includes full source code.  The tool is developed as a desktop AddIn and is written in C# using WPF and the WPF Toolkit.